 ben's notes
The Data 100 Cheat Sheet
Resources #
Textbook: http://www.textbook.ds100.org/ch/01/lifecycle_intro.html
Data Science Lifecycle #
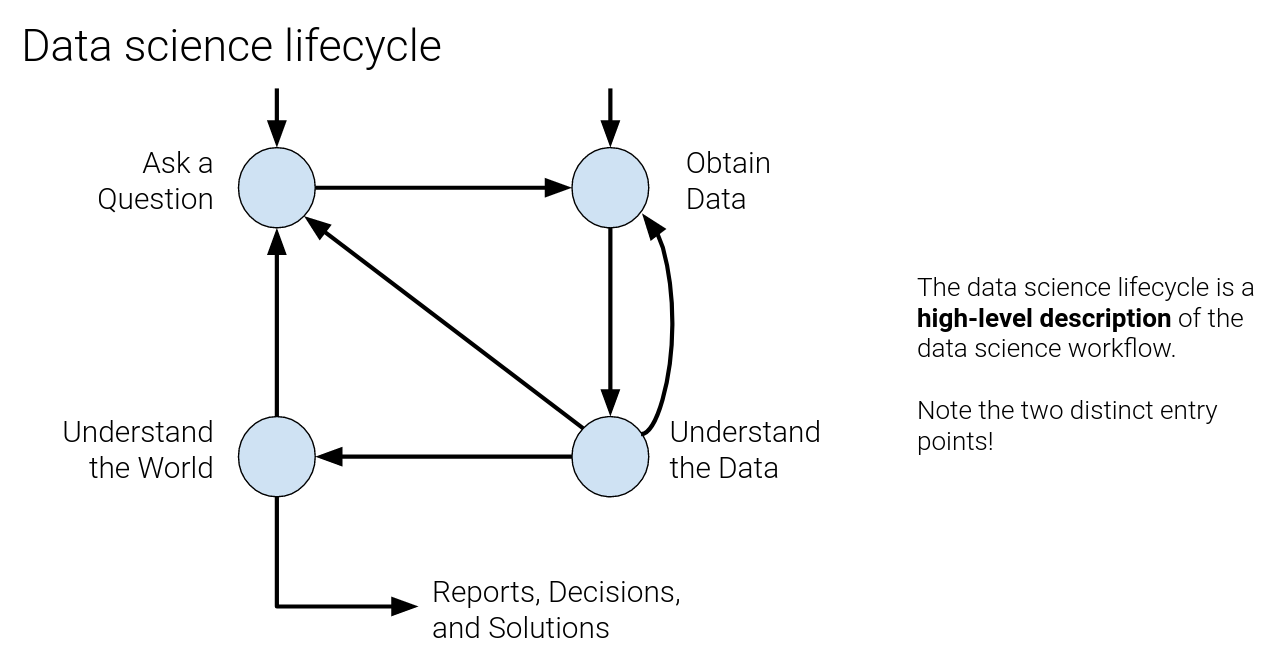
http://www.ds100.org/fa20/lecture/lec01/
Data Sampling #
Types of Samples #
A convenience sample is whoever you can get ahold of.
- Not a good idea for inference!
- Haphazard ≠ random.
- Sources of bias can introduce themselves in ways you may not think of!
In a quota sample, you first specify your desired breakdown of various subgroups, and then reach those targets however you can.
- For example: you may want to sample individuals in your town, and you may want the age distribution of your sample to match that of your town’s census results.
Quota samples are not random.
Samples and Population #
- Population: The group that you want to learn something about.
- Sampling Frame: The list from which the sample is drawn.
- If you’re sampling people, the sampling frame is the set of all people that could possibly end up in your sample.
- Sample: Who you actually end up sampling.
- A subset of your sampling frame.
- Samples are often used to make inferences about the population.
- How you draw the sample will affect your accuracy.
- Two common sources of error:
- chance error: random samples can vary from what is expected, in any direction.
- bias: a systematic error in one direction.
Types of Biases #
Selection Bias
- Systematically excluding (or favoring) particular groups.
- How to avoid: Examine the sampling frame and the method of sampling.
Response Bias
- People don’t always respond truthfully.
- How to avoid: Examine the nature of questions and the method of surveying.
Non-response Bias
- People don’t always respond.
- How to avoid: Keep your surveys short, and be persistent.
- People who don’t respond aren’t like the people who do!
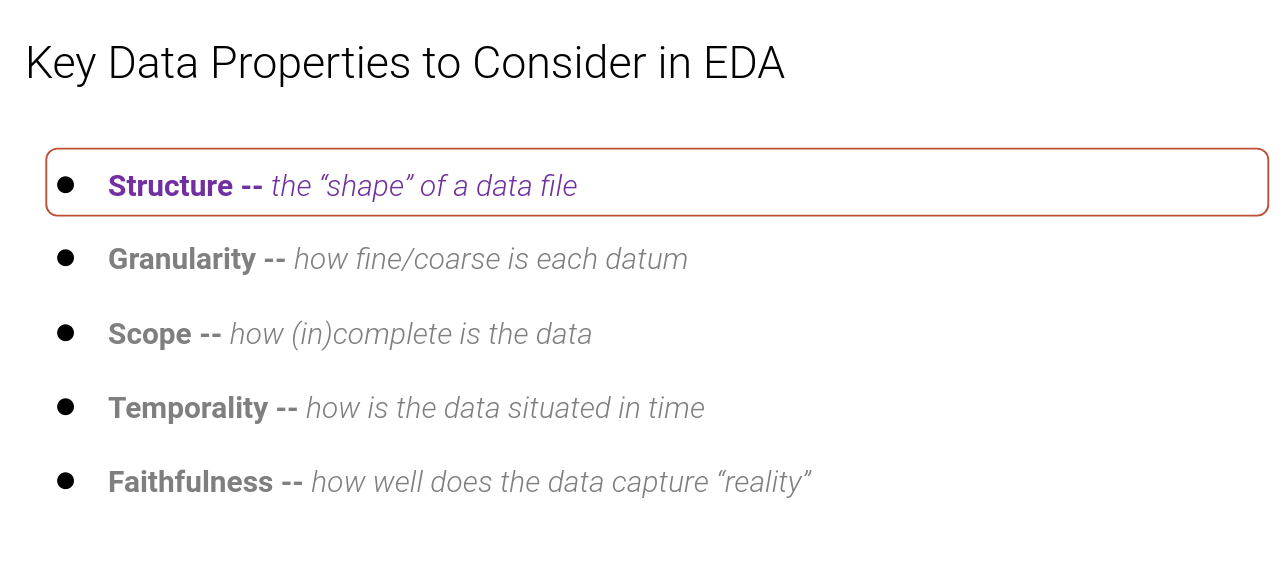
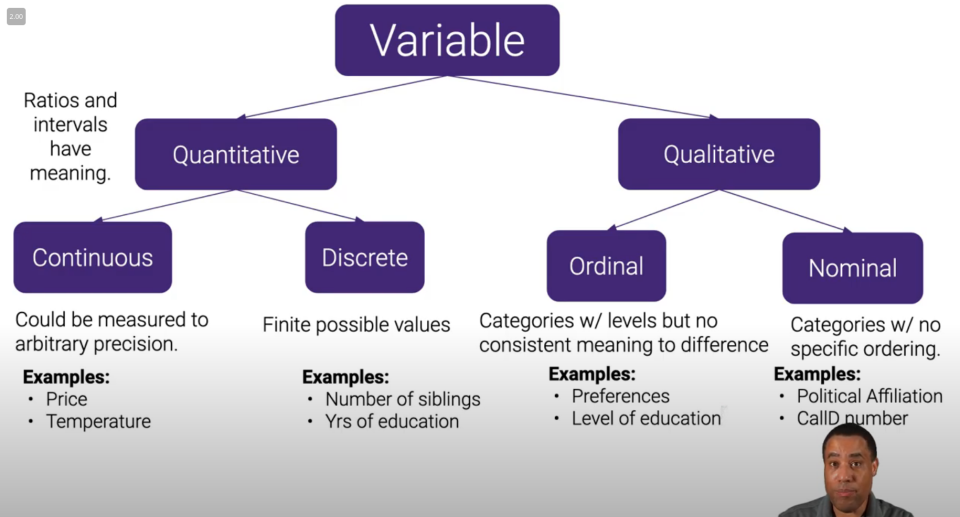
EDA #
Visualization #
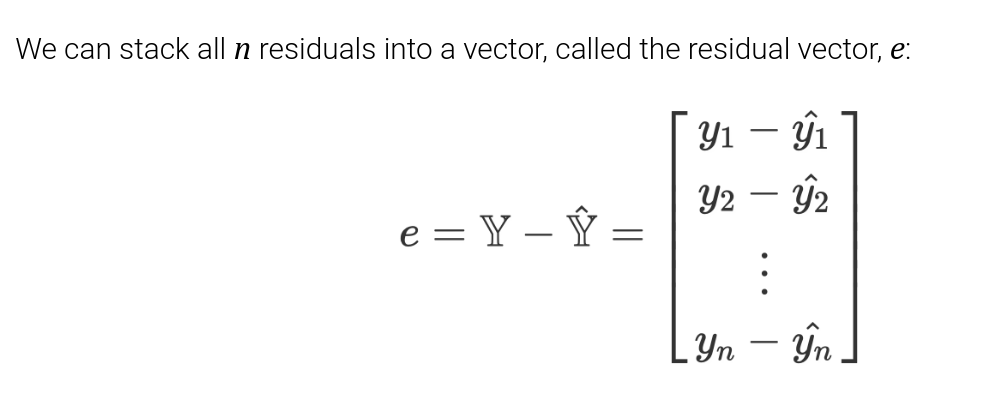
Modeling #
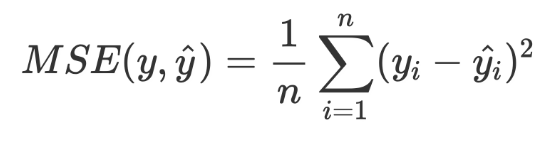
(RMSE is the square root of the MSE)
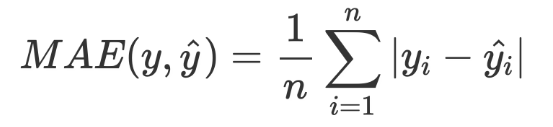
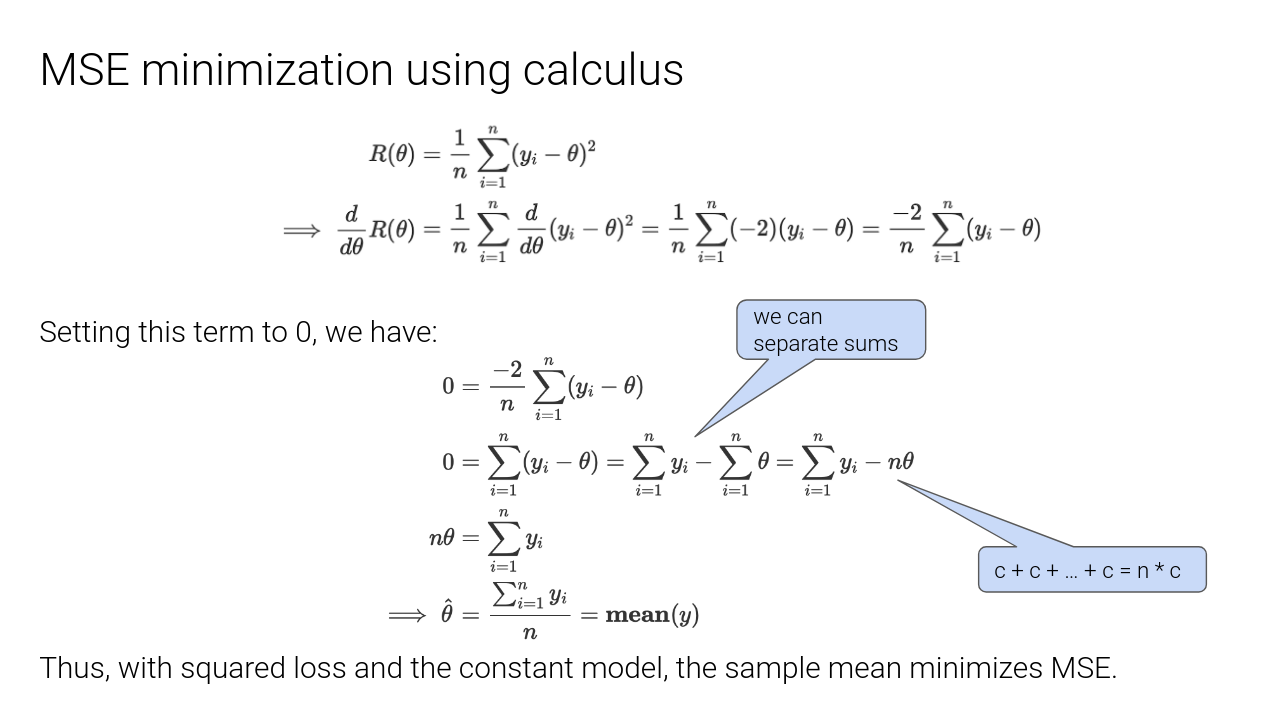
Min(MSE) is the sample variance.
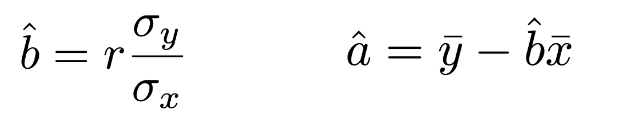
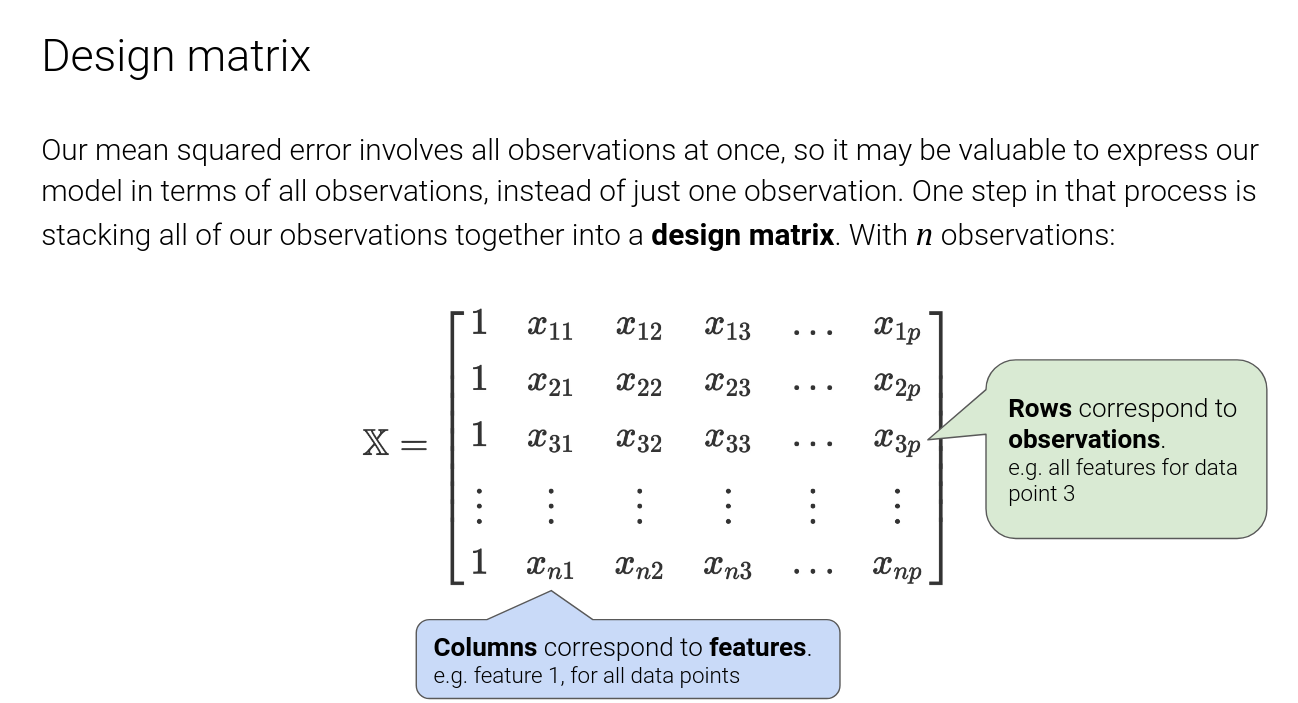
Linear Regression #
http://www.ds100.org/fa20/lecture/lec12/
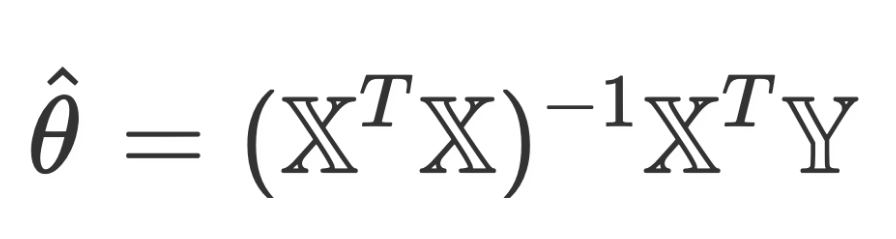
Optimal Parameters:
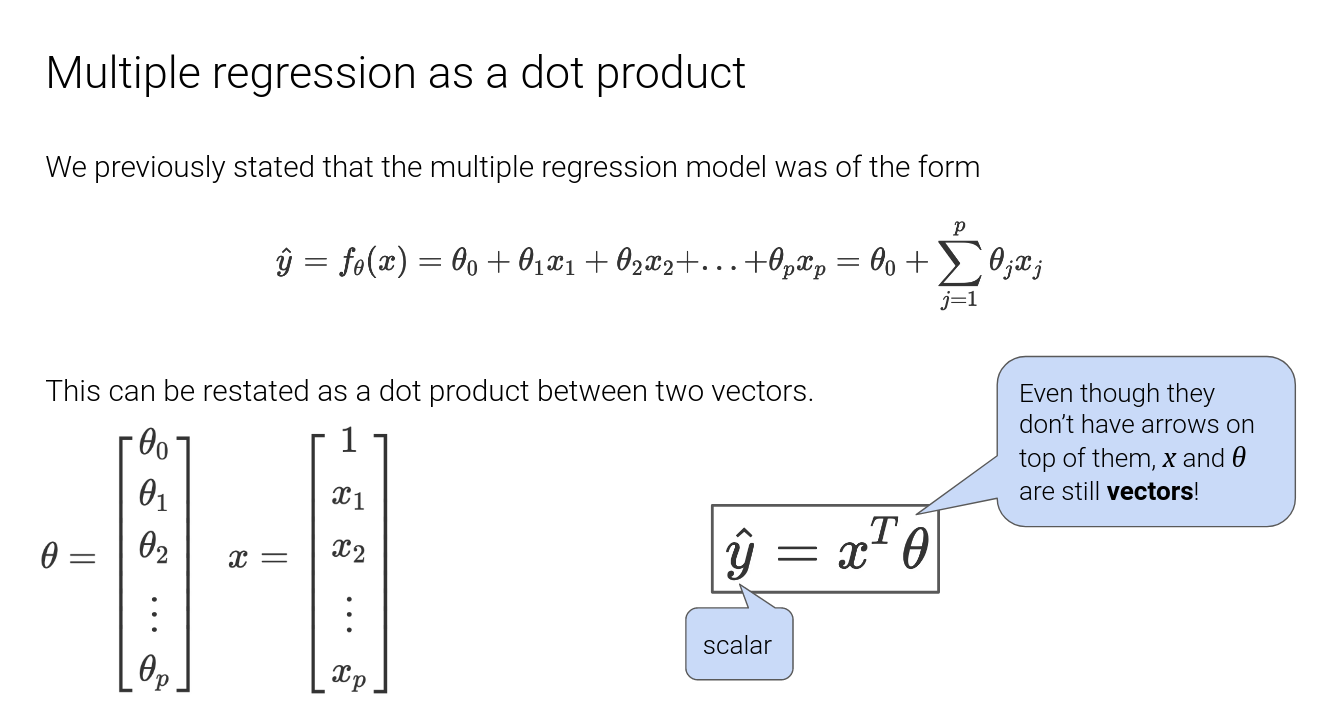
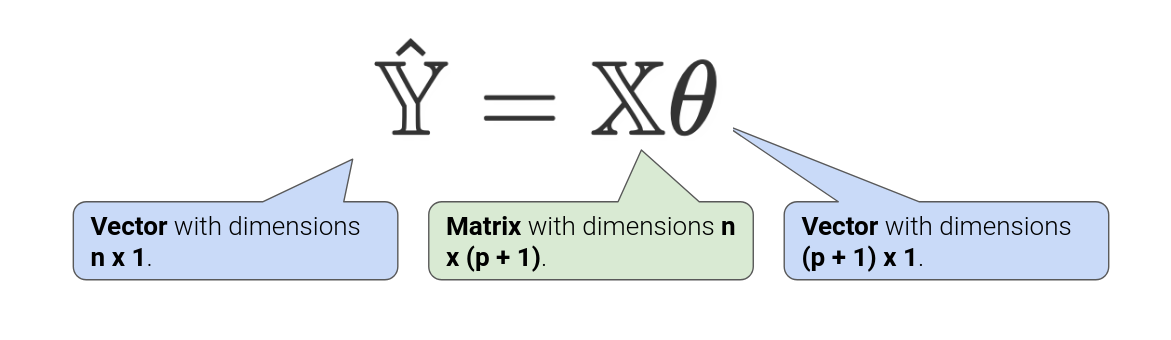
Least Squares Estimate
Feature Engineering #
http://www.ds100.org/fa20/lecture/lec14/
Uninformative features (e.g., UID) #
- Is this informative (probably not?)
- Transformation: remove uninformative features (why?)
- They could influence the model.
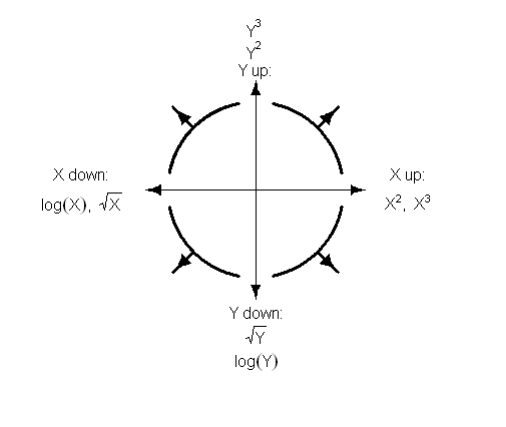
Quantitative Features (e.g., Age) #
- Transformation: May apply non-linear transformations (e.g., log)
- Transformation: Normalize/standardize (more on this later …)
- Example: (x – mean)/stdev
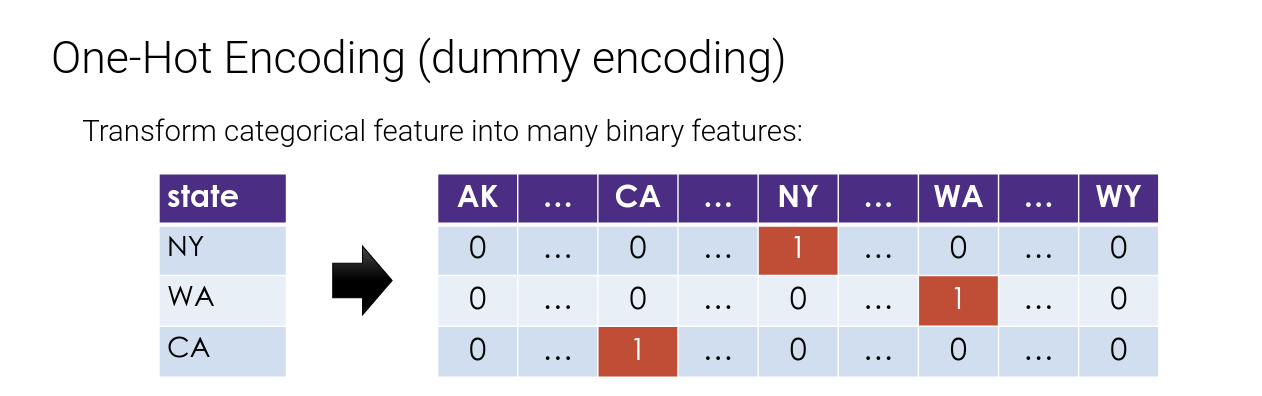
Categorical Features (e.g., State) #
How do we convert State into meaningful numbers?
- Alabama = 1 , …, Utah = 50 ?
- Implies order/magnitude means something … we don’t want that …
Transformation: One-hot-Encode
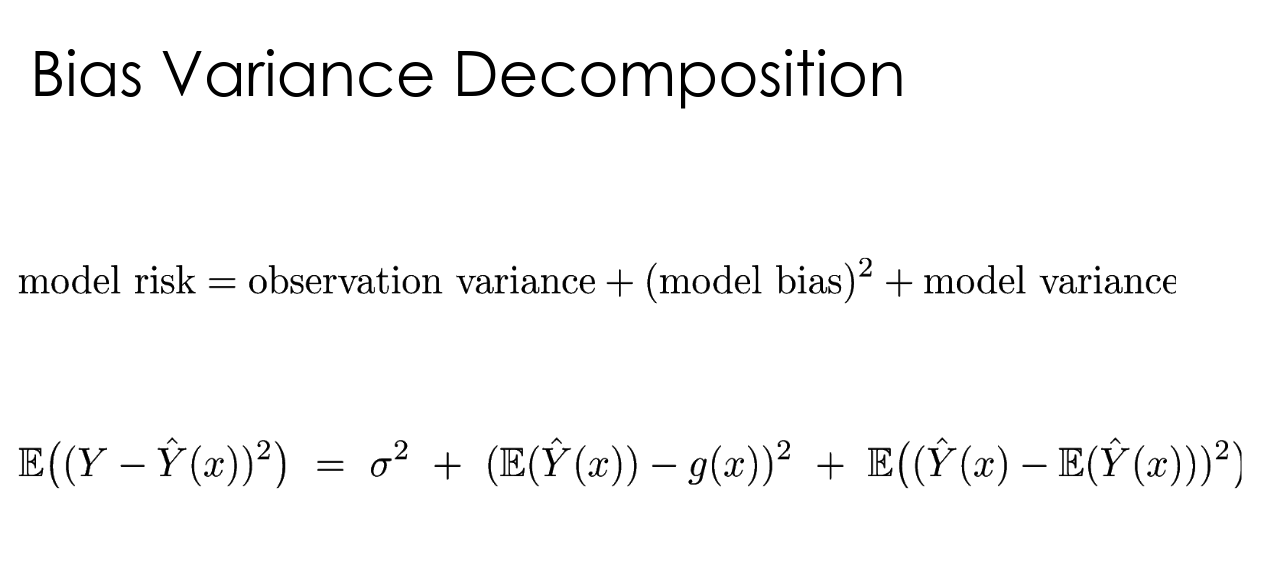
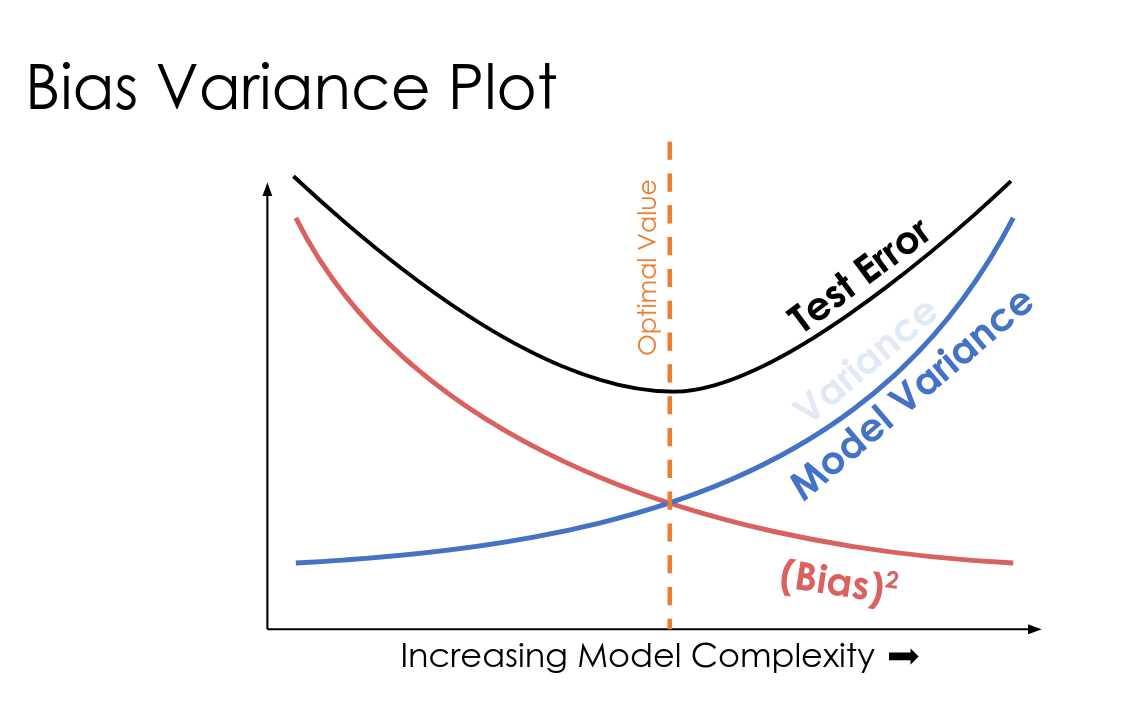
Bias and Variance #
Error #
Chance Error: Due to randomness. Appears in both observations and training sample
Bias: Non-random error due to model being different from true data
Positive bias = overestimate
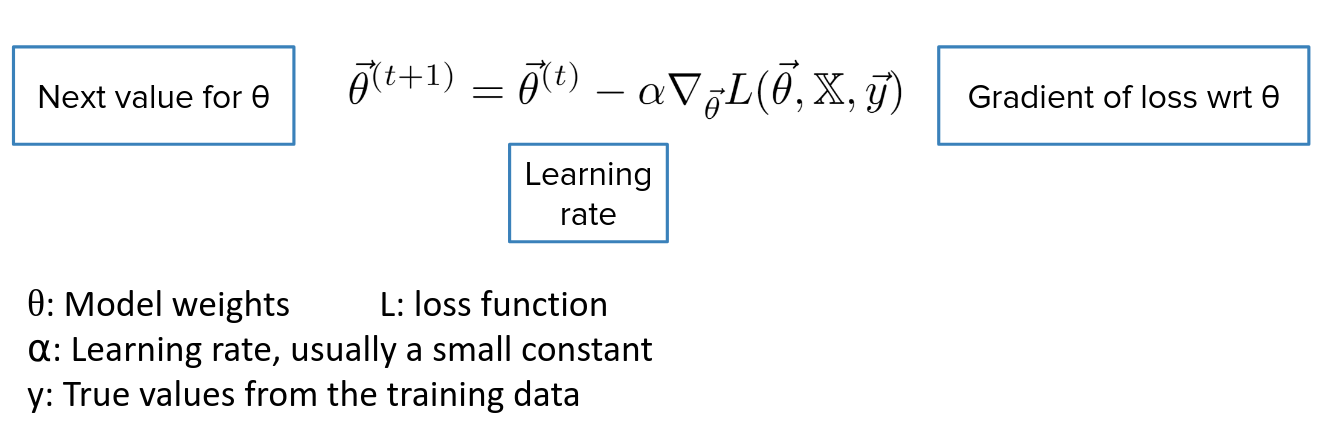
Gradient Descent #
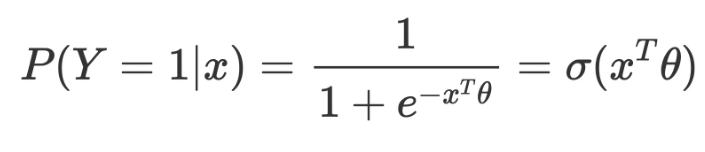
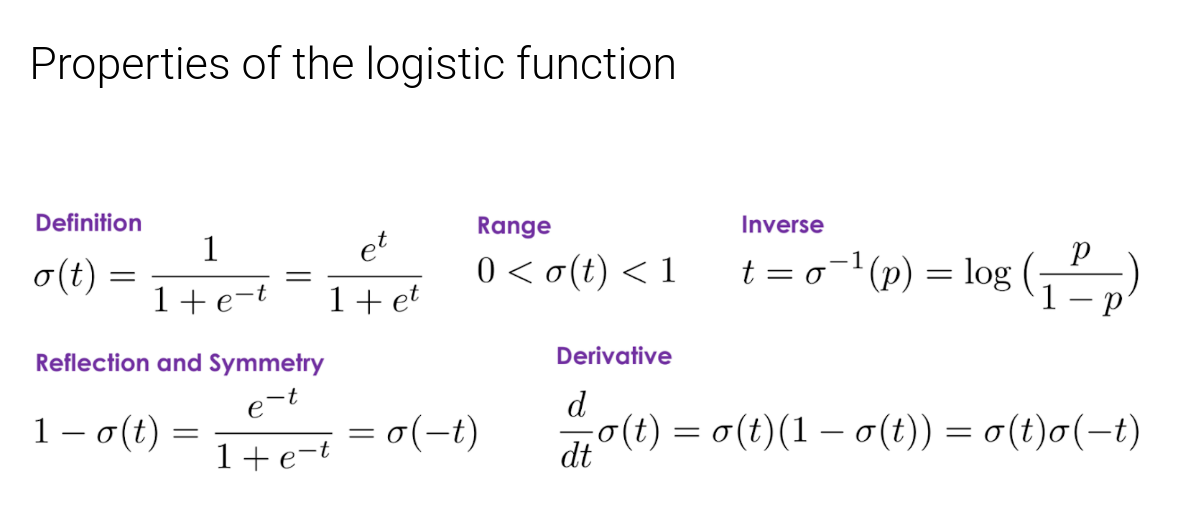
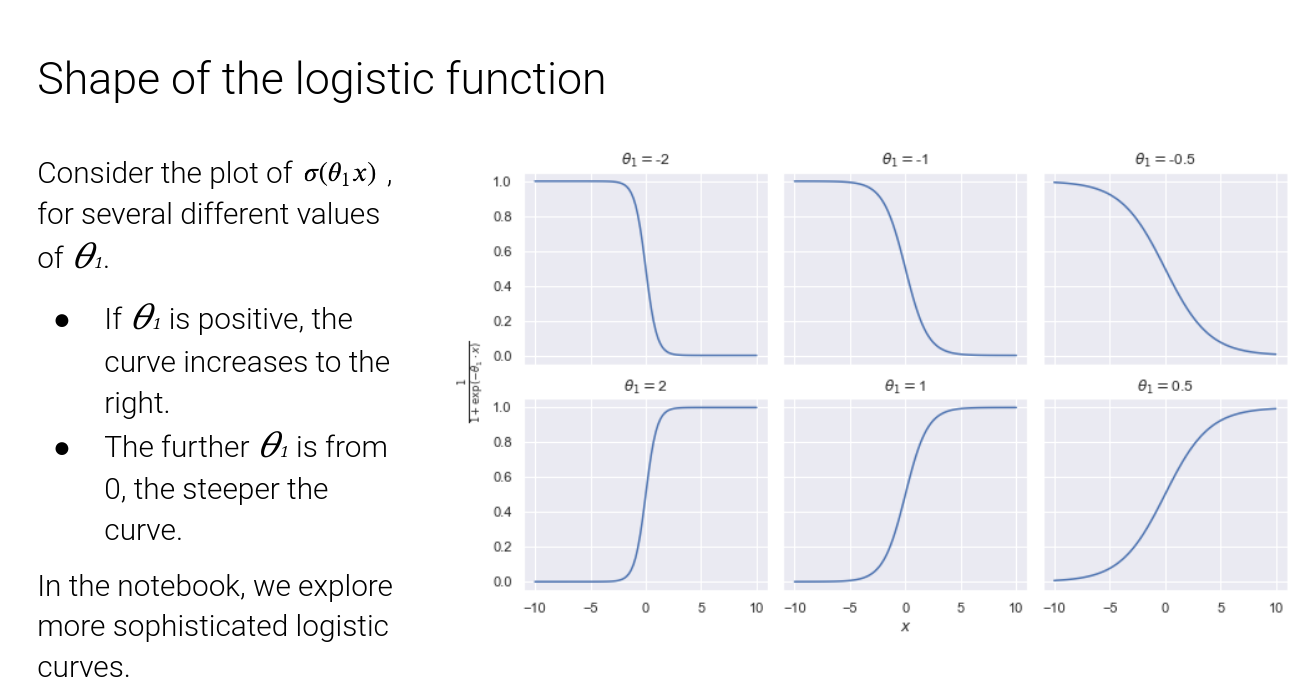
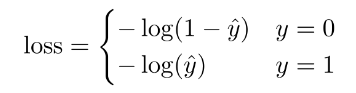
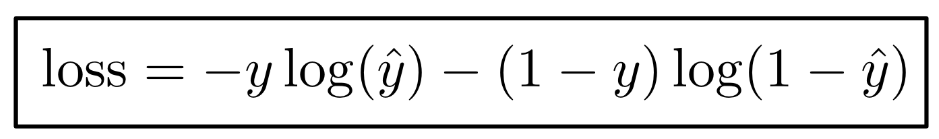
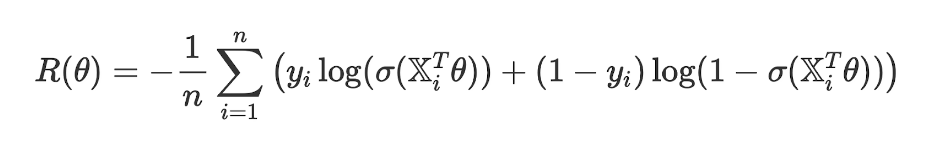
Logistic Regression #
http://www.ds100.org/fa20/lecture/lec18/
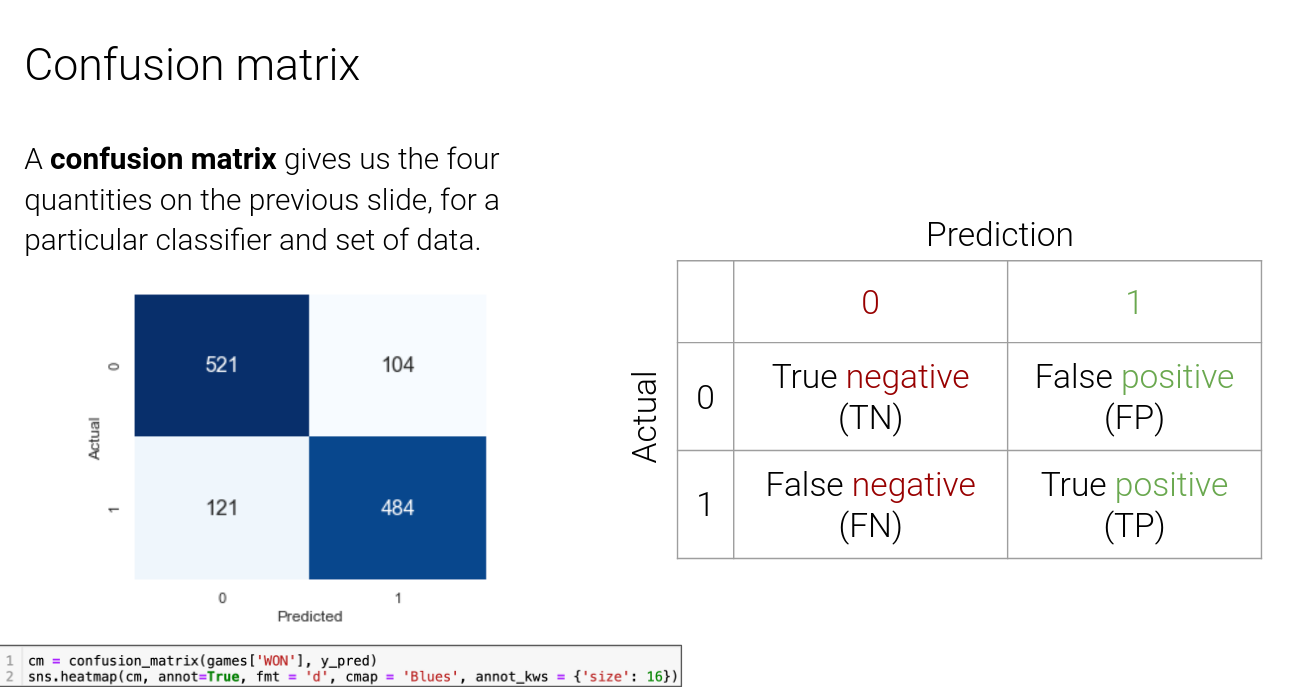
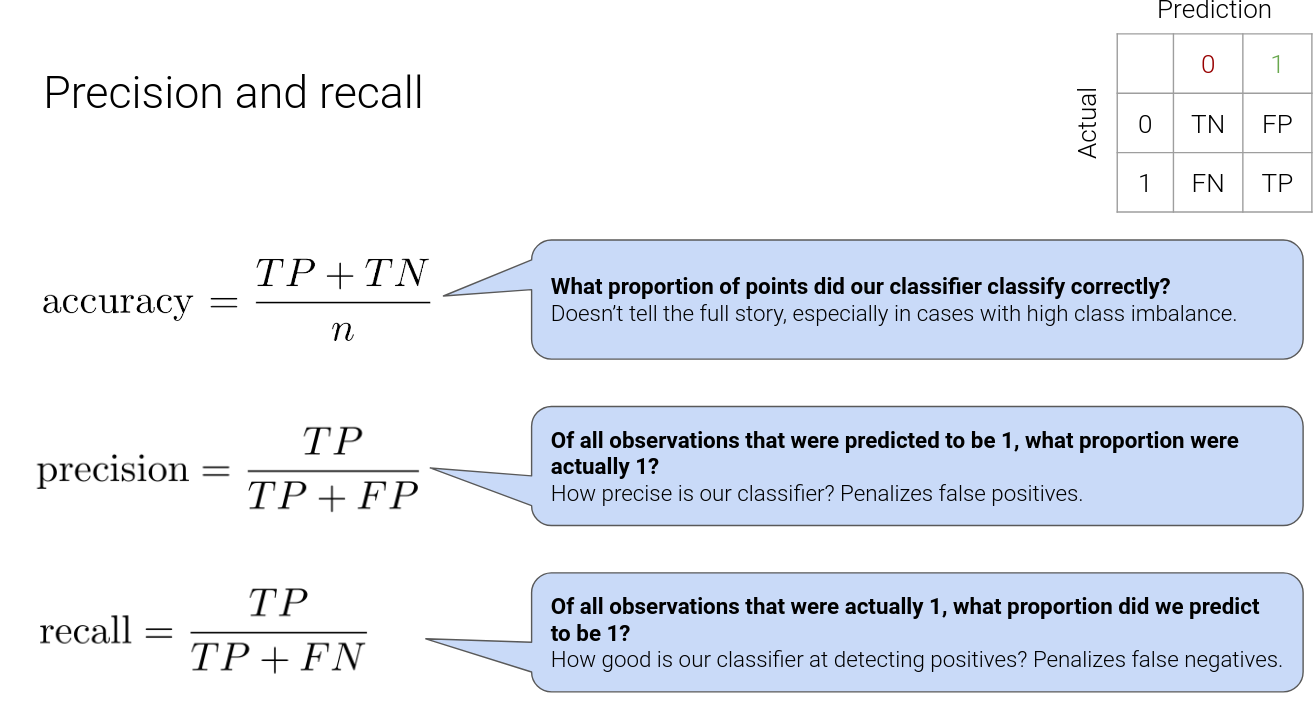
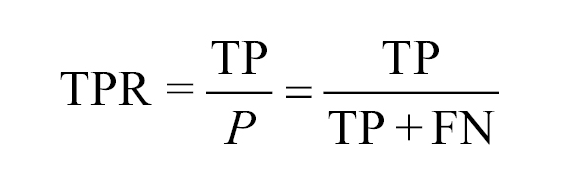
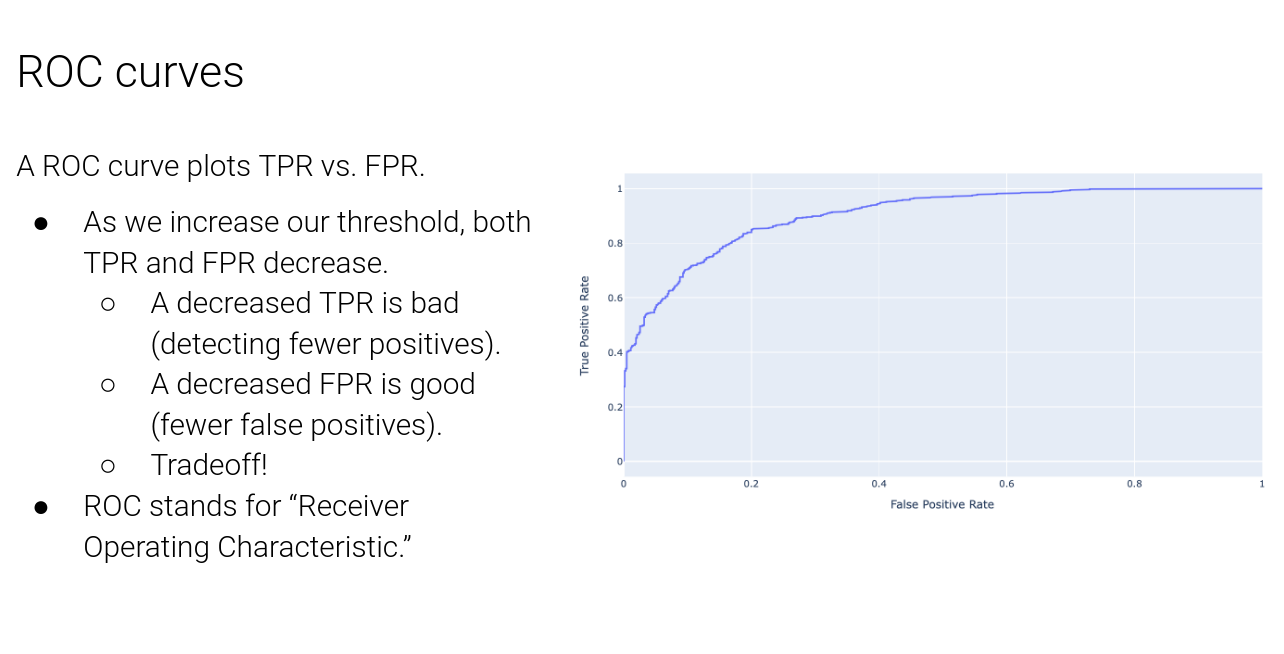
- Precision penalizes false positives, and recall penalizes false negatives.
- We can achieve 100% recall by making our classifier output “1”, regardless of the input.
- We would have no false negatives, but many false positives, and so our precision would be low.
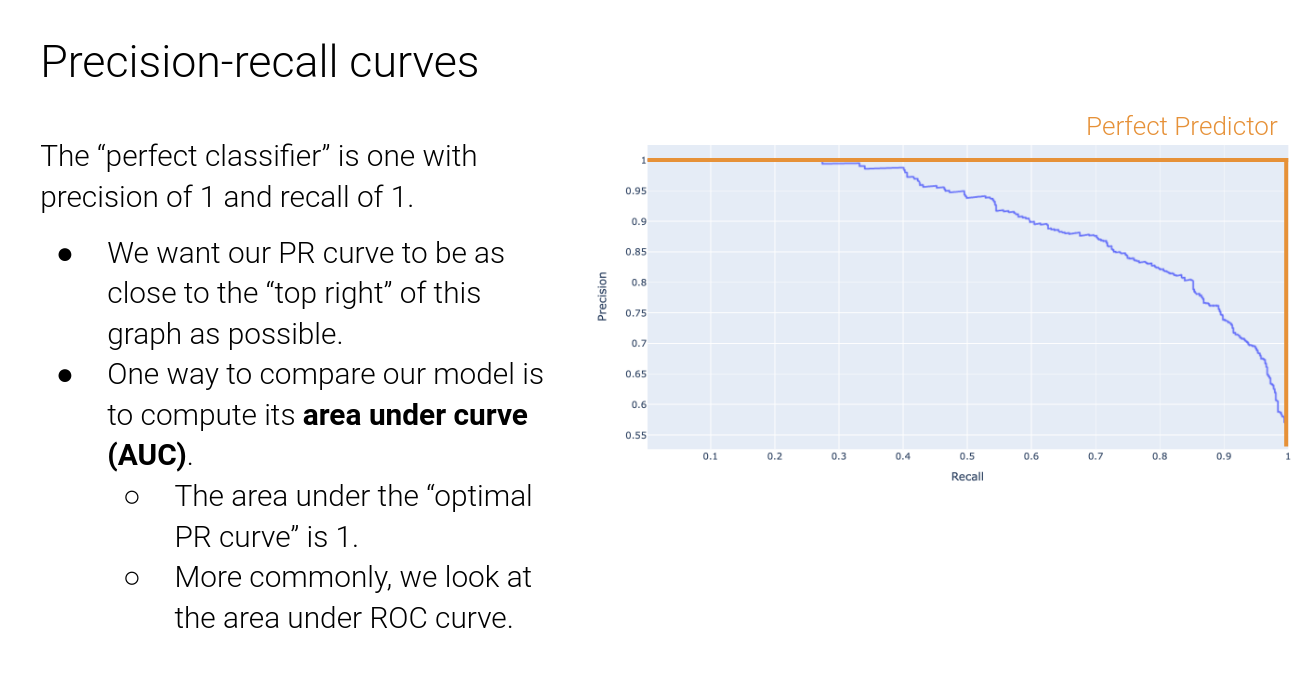
- This suggests that there is a tradeoff between precision and recall – they are inversely related.
- Ideally, both would be near 100%, but that’s unlikely to happen.
- We can adjust our classification threshold to suit our needs, depending on the domain.
- Higher threshold – fewer false positives. Precision tends to increase.
Lower threshold
– fewer false negatives.
Recall increases
.
In each of the following cases, what would we want to maximize: precision, recall, or accuracy?
Predicting whether or not a patient has some disease.
- Maximize recall.
- Presumably if we say someone has the disease, they will go through further testing.
- If we say they don’t, the condition may be left untreated, which is dangerous.
Determining whether or not someone should be sentenced to life in prison.
- Maximize precision.
- We don’t want to sentence guilty people, so we want to be very sure that this is a true positive.
Determining if an email is spam or ham.
- Maximize accuracy, though this one is subjective.
- Depends what you think is worse – having a bunch of spam emails ending up in your inbox, or a bunch of non-spam emails being filtered out.
Clustering #
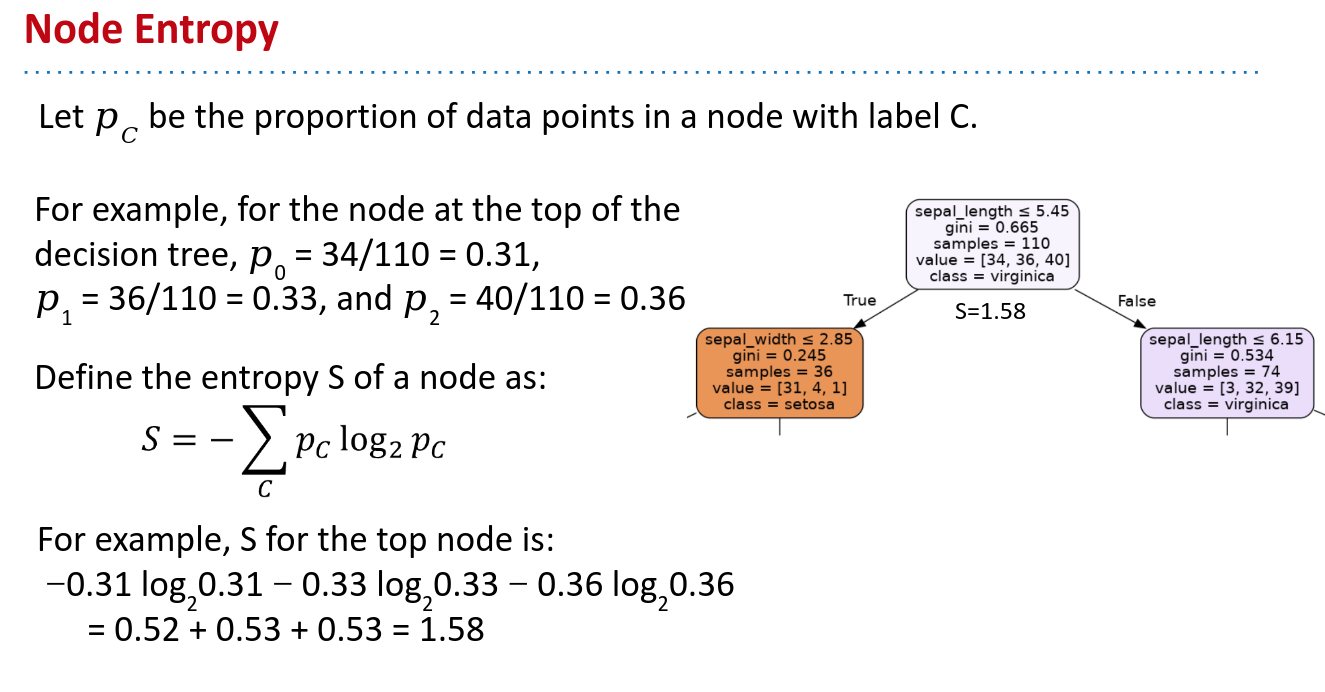
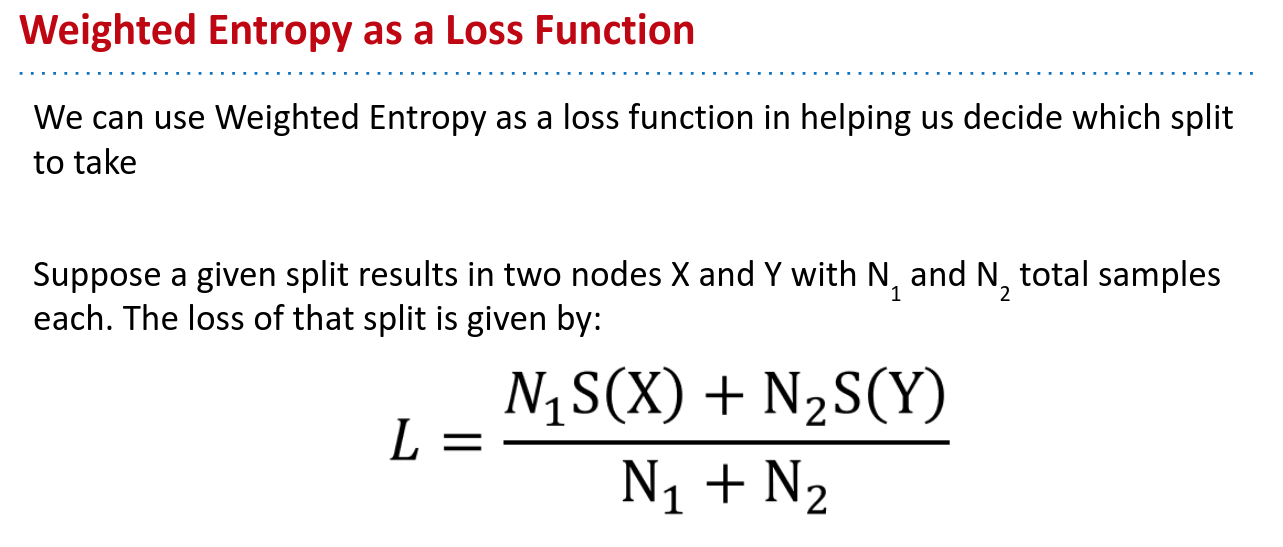
Decision Trees #
https://docs.google.com/presentation/d/1oN7at3ljTNtRgRR6wO7Di8O3vK4M2pKBzPL3zomot2s/edit
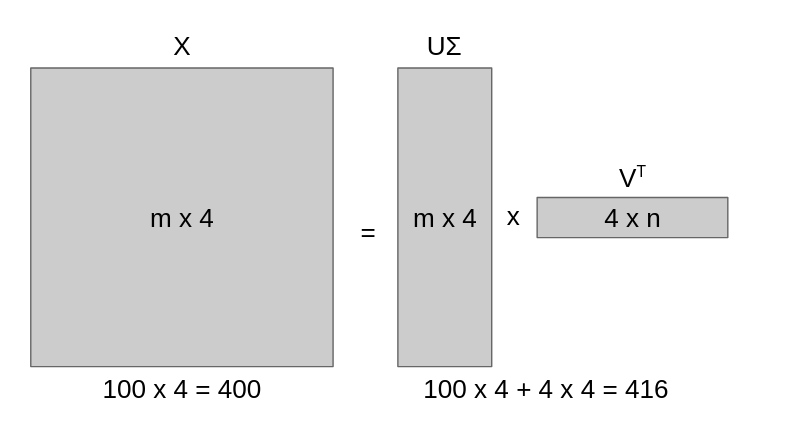
SVD/PCA #
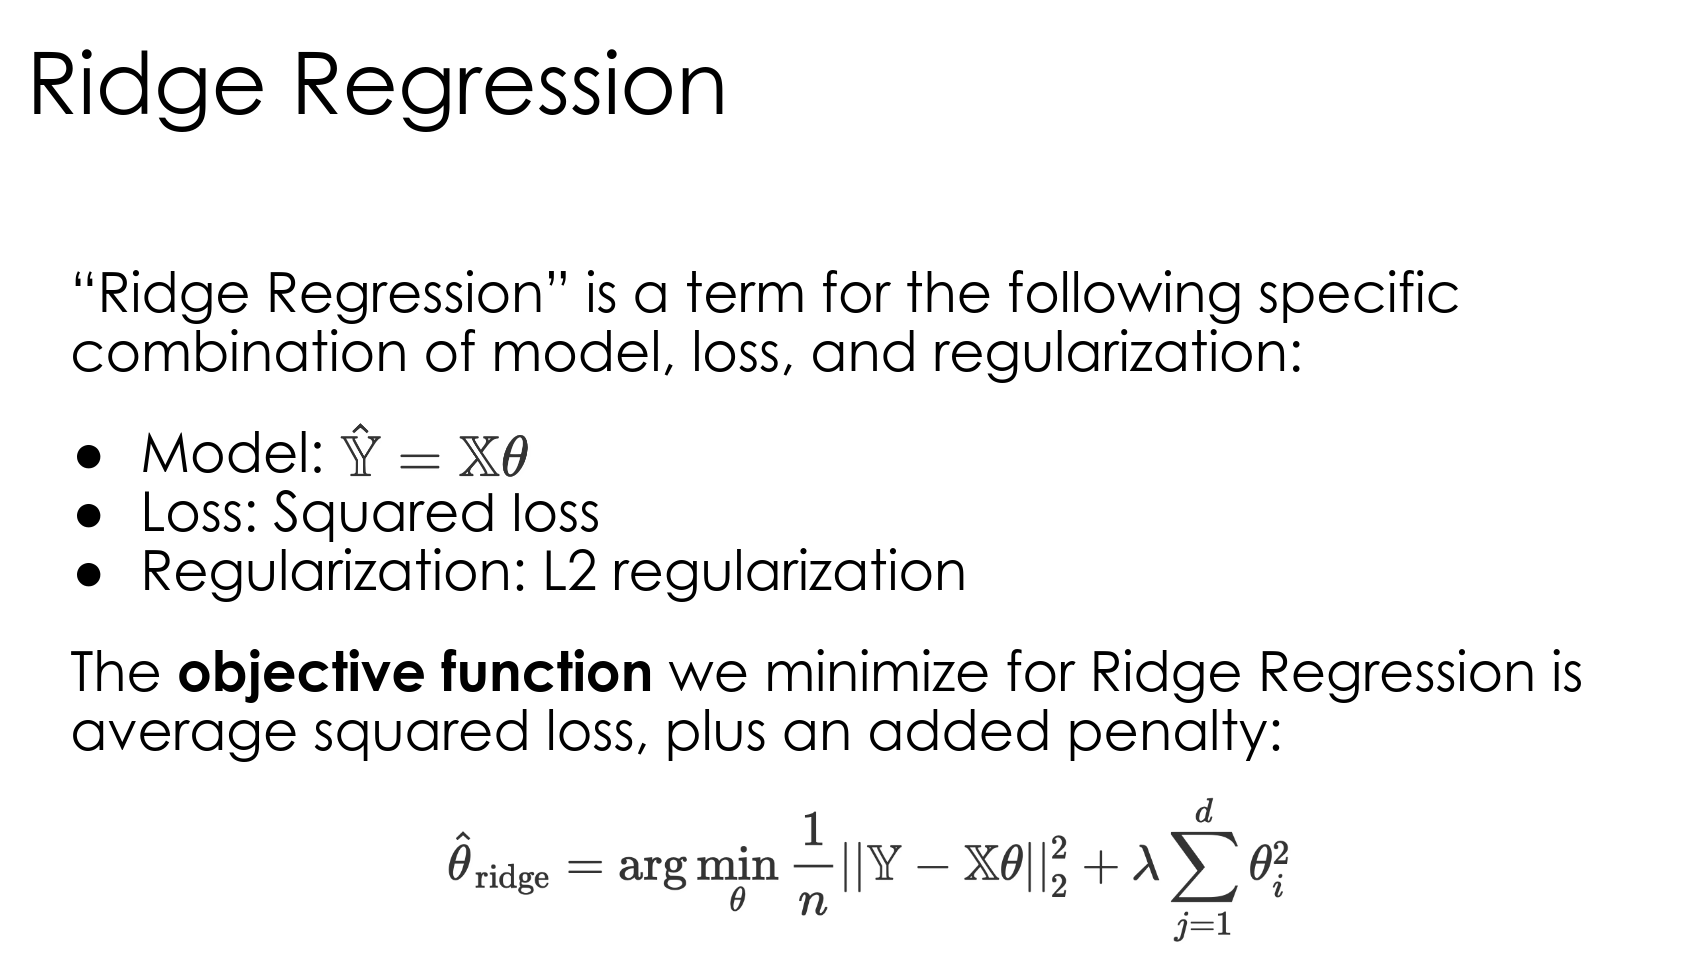
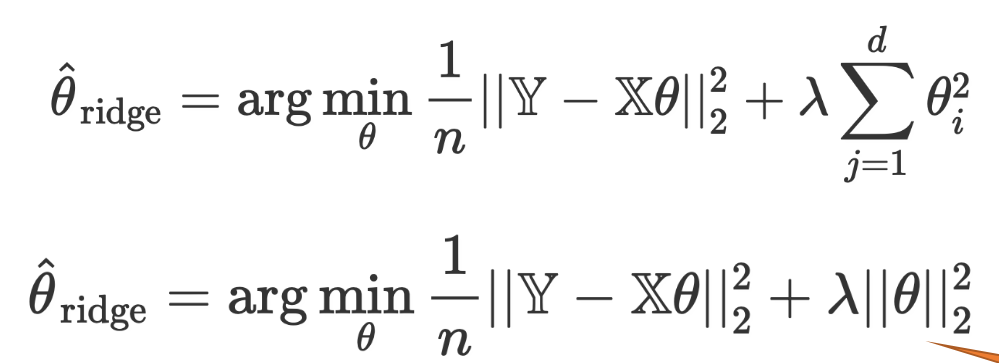
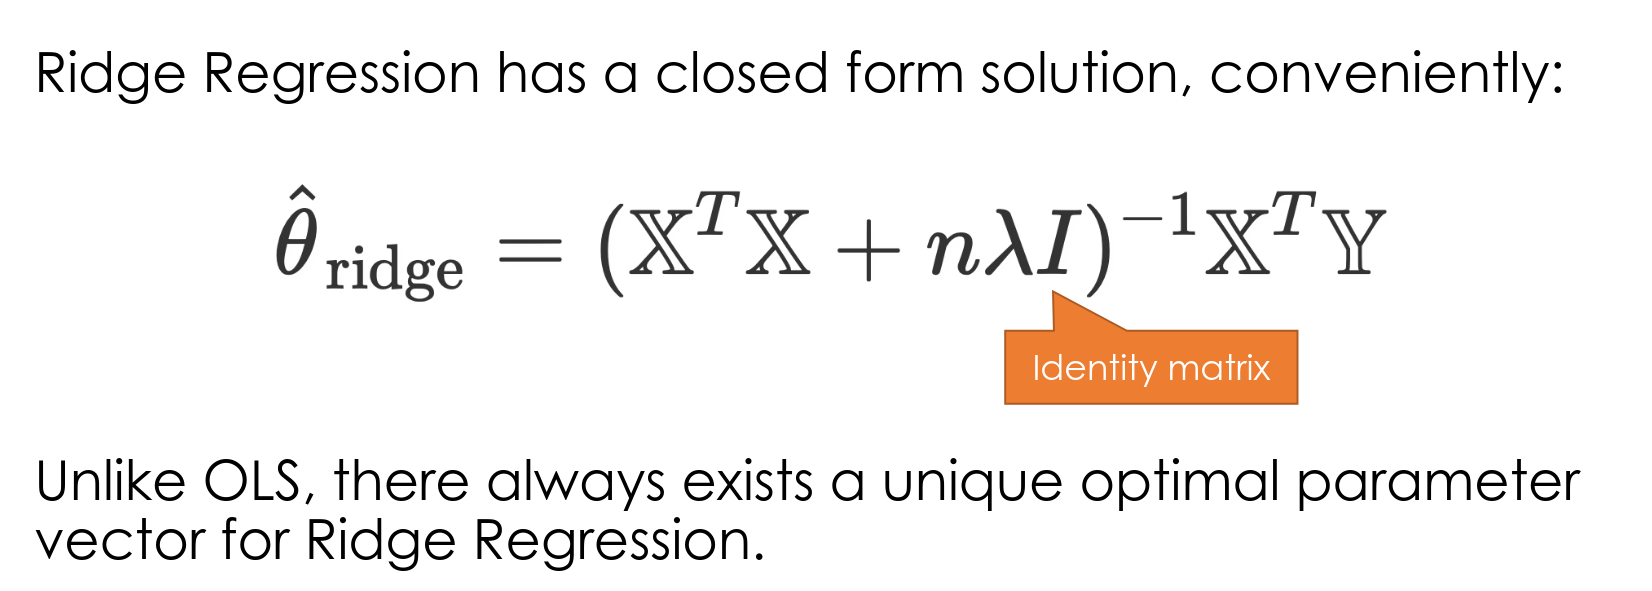
Ridge Regression #