 ben's notes
Binary Decision Making
Binary Decision Making is the simplest kind of decision we can make: 1 or 0, yes or now, true or false…
Setup #
In reality, a value is either 0 or 1. However, we observe noisy data that isn’t always 100% accurate. Given this noisy data, we make a decision (also either 0 or 1).
Some examples of binary decisions are:
- COVID testing (positive or negative)
- Fraud detection (fraud or no fraud)
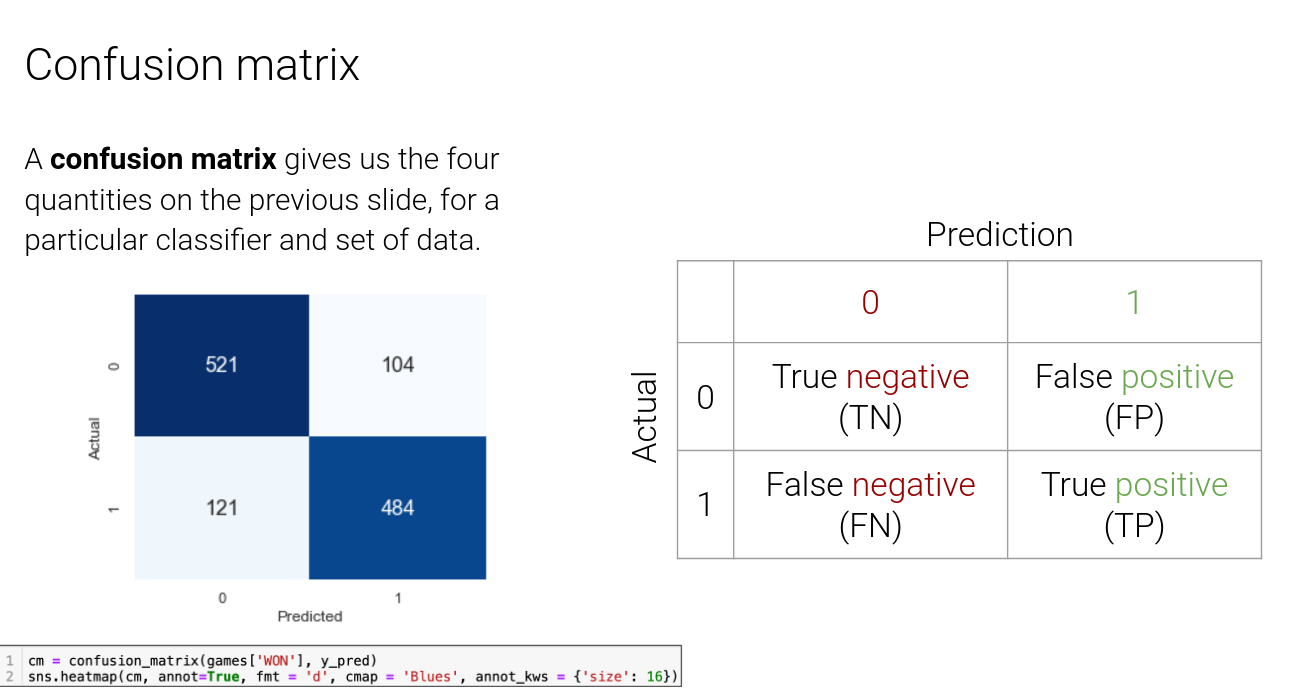
Confusion Matrix #
A 2x2 table that helps us evaluate how effective our predictions were (columns) given reality (rows).
Terminology #
https://en.wikipedia.org/wiki/Sensitivity_and_specificity Sensitivity = True Positive Rate Specificity = True Negative Rate
True Negative Rate (TNR): $n_{TN}/(n_{TN} + n_{FP})$ (top row-wise, proportion correct out of all negative results)
- 1 - TNR = False Positive Rate (FPR)
- TNR = P(decision = 0 | reality = 0)
- FPR = P(decision = 1 | reality = 0)
True Positive Rate (TPR): $n_{TP} / (n_{FN} + n_{TP})$ (bottom row-wise, proportion correct out of all positive results)
- 1 - TPR = False Negative Rate (FNR)
- TPR = P(decision = 1 | reality = 1)
- FNR = P(decision = 0 | reality = 1)
False Discovery Proportion (FDP): $n_{FP} / (n_{FP} + n_{TP})$ (right column-wise, proportion of false positives out of all positive predictions)
- Also known as False Discovery Rate (FDR)
- P(reality = 0 | decision = 1)
False Omission Proportion (FOP): $FN/(FN + TN)$ (left column-wise, proportion of false negatives out of all negative predictions)
Interpreting Row-wise and Column-wise rates #
Here’s an example of interpreting values using COVID testing:
- FPR: within people without COVID, how many test positive?
- FDP: within positive tests, how many people don’t have COVID? (when the algorithm predicts yes, how often is it wrong?)
Depending on the context, some values are more useful than others.
“Within reality” = row-wise, “Within tests” = column-wise Sensitivity, specificity, recall -> row-wise precision, positive predictive value -> column-wise
Randomness: Bayesian vs Frequentist #
We always assume that the data itself is random. Since decisions are based on data, decisions are also random.
However, depending on our mindset, we can either treat reality as fixed or random.
If reality is random (Bayesian mindset):
- We need to specify how exactly reality is random (probability distribution for P(R=0), P(R=1)
- $P(R=1) = \pi_1$ (base rate or prevalence - how often a positive value actually occurs)
- $\pi_1 = 1 - \pi_0$
If reality is fixed (Frequentist mindset):
- Need row-wise error rates (FPR, FNR) to be as small as possible (need some tradeoffs)
- Column-wise rates fixed
- P(R=0|D=0) is not defined (since it’s not a probability!)
- TNR can still be defined as a proportion of values though
Relating column-wise and row-wise rates #
Using Bayes’ rule:
$$FDP = P(R=0|D=1) = \frac{P(D=1|R=0)P(R=0)}{P(D=1)}$$$$ = \frac{P(D=1|R=0)P(R=0)}{P(D=1|R=0)P(R=0) + P(D=1|R=1)P(R=1)}$$$$FDP = \frac{FPR \cdot \pi_0}{FPR \cdot \pi_0 + TPR \cdot \pi_1} = \frac{1}{1+ \frac{TPR}{FPR} \cdot \frac{\pi_1}{\pi_0}}$$This expresses FDP, a column-wise rate, to TPR and FPR, which are both row-wise rates. Recall that $\pi_0$ and $\pi_1$ are the probabilities of the reality being 0 and 1, respectively.
The primary implication is that FDP approaches 0 as $\pi_1 >> \pi_0$, and approaches 1 as $\pi_1 << \pi_0$.
A secondary implication is that as TPR increases, FDP decreases (good); as FPR increases, FDP increases (bad).
Summary of implications:
- The worse the test is (large FPR), the higher the FDP.
- The less prevalent an event is (small $\pi_1$), the higher the FDP.